Title here
Summary here
December 5, 2018 in Systems10 minutes
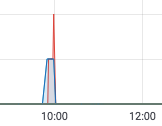
I awoke yesterday to a very crisp Tuesday morning in Portland, Oregon. I had just poured myself a nice glass of Stumptown Nitro cold brew coffee, and wandered upstairs to my office for an 8AM conference call. I joined the meeting, and started going through my usual routine - part of which includes looking at the day’s NRE Labs stats. Here’s what I saw:

Well, that kind of sucks.
First, a few architectural notes on Kubernetes. The Kubernetes “master” is actually three discrete subcomponents:

Image credit: The New Stack
Underlying these three components is etcd, which is a key/value database that holds all state for Kubernetes. This allow the subcomponents of Kubernetes to remain stateless. However, what this means is that etcd is a crucial component of any Kubernetes cluster. Without etcd, you don’t have Kubernetes. More on that later.
In addition, in the Antidote project specifically, which is what powers NRE Labs, the way we’re currently building our Kubernetes cluster is with a tool called kubeadm. This allows us to easily create a single-master cluster, which is another way of saying that all of the master services, including everything in the above diagram, on a single node - in our case, a virtual machine in GCP.
As mentioned in the very beginning of the Kubernetes HA Guide, kubeadm will by default, install and configure a single-node etcd cluster as a static pod, managed by the kubelet. It does this for simplicity.
The tradeoff here is that we get the benefits of being able to easily create a cluster, while taking on the disadvantages with running everything on a single node. Since NRE Labs has no SLA, as it’s currently in tech preview, this is a pretty good tradeoff in these early days. Over time, the HA design of the cluster will become more important.
This is actually pretty cool. With a single command, kubeadm will create everything needed to run a single-master cluster. As part of this, kubeadm will create static pod manifests for all of the master components we saw previously, including etcd:
[mierdin@antidote-controller-jm02 ~]$ sudo kubeadm init --kubernetes-version=1.12.3 --apiserver-cert-extra-sans k8s.networkreliability.engineering
[init] using Kubernetes version: v1.12.3

 ...truncated...

[controlplane] wrote Static Pod manifest for component kube-apiserver to "/etc/kubernetes/manifests/kube-apiserver.yaml"
[controlplane] wrote Static Pod manifest for component kube-controller-manager to "/etc/kubernetes/manifests/kube-controller-manager.yaml"
[controlplane] wrote Static Pod manifest for component kube-scheduler to "/etc/kubernetes/manifests/kube-scheduler.yaml"
[etcd] Wrote Static Pod manifest for a local etcd instance to "/etc/kubernetes/manifests/etcd.yaml"
Now that you’re up to speed on how we have things set up, let’s dive into what went wrong yesterday.
Since NRE Labs runs on top of Kubernetes, the very first troubleshooting step usually involves some kind of kubectl command. Usually, I like to check on the pods in the prod namespace, which is where the important Antidote components run. I quickly discovered that something was definitely wrong, as I couldn’t even connect to the cluster:
~$ kubectl get pods -n=prod

The connection to the server 1.2.3.4:6443 was refused - did you specify the right host or port?
I was, however, able to connect via SSH to the GCE instance that should be running the Kubernetes master, and I noticed there was no mention of the API server in the output of docker ps. I’m not ashamed to admit that this caused me a little panic, but as an unfortunate byproduct, I missed a little more useful information that might have saved me some time. In any case, my gut instinct was to restart the kubelet, which I did right away:
systemctl restart kubelet
Interestingly enough, this seemed to work, as I was able to connect via kubectl once again. Once the syringe pod was restarted, and was able to reconnect to the Kubernetes API, everything seemed to be okay. I then went to the NRE Labs site, and was able to boot up a few lessons. I took this to mean things were back up and running, so I sent this out:
I believe GCP did some maintenance last night, and our cluster master didn't quite come back up correctly. Restarted the kubelet, and the syringe pod and I'm able to load a few lessons successfully now. Apologies for the outage, please let us know if you encounter any more issues
— NRE Labs (@NRELabs) December 4, 2018
This announcement turned out to be premature - as I noticed shortly thereafter, lesson activity tanked once again:
I started back into debugging mode, and I noticed that one of the nodes was running on a different version than the rest of the cluster:
~$ kubectl get nodes

NAME                       STATUS    ROLES     AGE       VERSION
antidote-controller-4m3j   Ready     master    65d       v1.12.1
antidote-worker-3m7f       Ready     <none>    65d       v1.12.1
antidote-worker-3mcj       Ready     <none>    65d       v1.12.1
antidote-worker-gt5t       Ready     <none>    3d        v1.11.3
I knew this was probably my fault, as I had removed and added a node earlier in the week, and must have fat-fingered the version number in one of my playbooks.
I also checked on all of the pods in kube-system - these are all the services that power the cluster itself. You’ll find etcd, the API server, coredns, and a few other things here:
~$ kubectl get pods -n=kube-system

NAME                                               READY     STATUS    RESTARTS   AGE
coredns-78fcdf6894-8q7tg                           1/1       Running   0          3d
coredns-78fcdf6894-wh5rc                           1/1       Running   1          3d
etcd-antidote-controller-4m3j                      1/1       Running   183        58d
kube-apiserver-antidote-controller-4m3j            1/1       Running   183        58d
kube-controller-manager-antidote-controller-4m3j   1/1       Running   91         58d

...truncated
If I had taken two seconds to read the output in more detail, beyond just making sure everything was Running, I would have noticed that the etcd and API server pods had restarted a whopping 183 times.
And here’s where I really let my emotions get the better of me. Rather than take my time, and get the right answers, I got “terraform drunk” and decided to blow the entire cluster away with terraform destroy and rebuild it. After all, the creation of the cluster is fully automated, so it shouldn’t take much time to bring it back online, and I needed to update the cluster version because of the recently disclosed vulnerability in this version.
After about 30 minutes or so, the terraform+ansible process finished. Unfortunately, I didn’t have to wait long to realize the issue was back, even on a totally fresh cluster.
Time to keep digging deeper.
I couldn’t connect to the API server, so getting logs with kubectl logs was out of the question. I once again had to SSH to the controller node and interact directly with docker. Doing this showed that etcd was indeed constantly starting, and shutting down (just two copies shown below):
[mierdin@antidote-controller-zk2x ~]$ sudo docker ps -a
CONTAINER ID        IMAGE                  COMMAND                  CREATED             STATUS                     NAMES
ddcb1af47db5        3cab8e1b9802           "etcd --advertise-..."   52 seconds ago      Up 51 seconds              k8s_etcd_etcd-antidote-controller-zk2x_kube-system_9a8ab44e28b43ed1203b49f15201573e_1
aa0bff115153        3cab8e1b9802           "etcd --advertise-..."   2 minutes ago       Exited (0) 51 seconds ago      k8s_etcd_etcd-antidote-controller-zk2x_kube-system_9a8ab44e28b43ed1203b49f15201573e_0
In particular, I was able to access both etcd and the API server for around 1.5 to 2 minutes before it went offline. This seemed to map very closely to the behavior I observed when I initially thought things were working again. They did work, but only for a few minutes, and then everything tanked again.
Checking the logs of these terminated containers yielded something very interesting. With one exception, the logs showed a very normal etcd startup process:
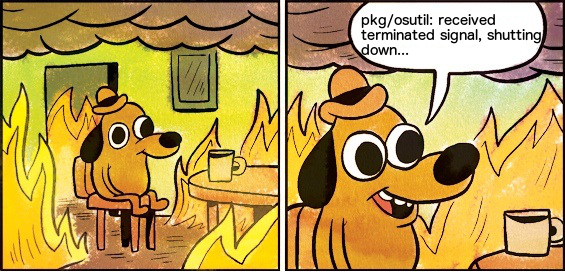
2018-12-04 22:47:14.729606 I | embed: serving client requests on 127.0.0.1:2379
2018-12-04 22:48:46.050580 N | pkg/osutil: received terminated signal, shutting down...
The first line indicated “serving client requests”, tells me that etcd is up and running. And indeed, during this time, everything seems to work. For an average of 2 minutes, that’s the last log entry I see. But inevitably, and at about 2 minutes, that second line shows up, indicating that something external to the etcd process is setting a SIGTERM. Something is killing our etcd pod.
Immediately my attention turns to the kubelet. There’s really no other possible suspect. I don’t yet know why the kubelet is doing this, but I strongly suspect it’s at least involved, which the kubelet logs seem to indicate as well:
Dec 04 20:59:24 antidote-controller-6m4d kubelet[23953]: I1204 20:59:24.234181 23953 kuberuntime_manager.go:513] Container {Name:etcd...truncated....} is dead, but RestartPolicy says that we should restart it.
It’s time to reverse to the beginning of this post for a minute. Remember how I mentioned kubeadm creates a bunch of Kubernetes manifest definitions, including one for the static etcd pod, and uses these to create the master infrastructure? Well, if we take a peek at the etcd definition, we see an interesting section:
    livenessProbe:
      exec:
        command:
        - /bin/sh
        - -ec
        - ETCDCTL_API=3 etcdctl --endpoints=https://[127.0.0.1]:2379 --cacert=/etc/kubernetes/pki/etcd/ca.crt
          --cert=/etc/kubernetes/pki/etcd/healthcheck-client.crt --key=/etc/kubernetes/pki/etcd/healthcheck-client.key
          get foo
      failureThreshold: 8
      initialDelaySeconds: 15
      timeoutSeconds: 15
If you’re not familiar with kubernetes liveness probes, they’re actually a really valuable tool for ensuring your pods are actually working. Rather than just relying on whether or not the process inside the pod is running to indicate pod health, liveness probes allow us to execute certain commands, such as sending HTTP requests, to really confirm that the application is working.
In this case, kubeadm created a liveness probe that checks for the presence of a key foo. If it’s able to do this successfully, it marks the Pod as healthy, and kubernetes leaves it alone. If it fails, the kubelet will restart the pod in an attempt to get things working again.
We can see that failureThreshold is set to 8, and timeoutSeconds is set to 15. Multiply these together and you have two minutes - the exact time we were observing the restart behavior from the outside looking in.
We have our smoking gun. Something about this liveness probe is failing, and the kubelet is doing what it should be doing - restarting the pod in an effort to get things working again. It doesn’t appear that etcd is actually broken, but for some reason this liveness check was failing.
Unfortunately I wasn’t able to replicate the failure of this liveness probe. I ran the exact same command myself, and each time, etcdctl returned an error code of 0.
So, to get things working again, I elected to simply remove the liveness check, since it appeared this was the only thing that wasn’t working. Etcd wasn’t actually unhealthy, the kubelet just thought it was.
I edited the kubernetes manifest created by kubeadm and removed the entire liveness probe section. Then, I waited for the next etcd restart, and quickly applied the changes with kubectl apply
However, this still leaves me with a few unanswered questions:
I would love to hear from you if you have theories or answers - @mierdin.
Even though NRE Labs is still in tech preview, and it’s very much a community project, I still take these outages seriously, because I believe in what we’ve done with it, and what it can do for network automation and NRE education in the industry. It makes me cringe to think someone’s first experience with NRE Labs might have been during this window.
Nevertheless, as always, these are great learning experiences. Some takeaways - first, the good:
The obvious:
The Simple, but Less Obvious