Title here
Summary here
March 14, 2016 in Systems17 minutes
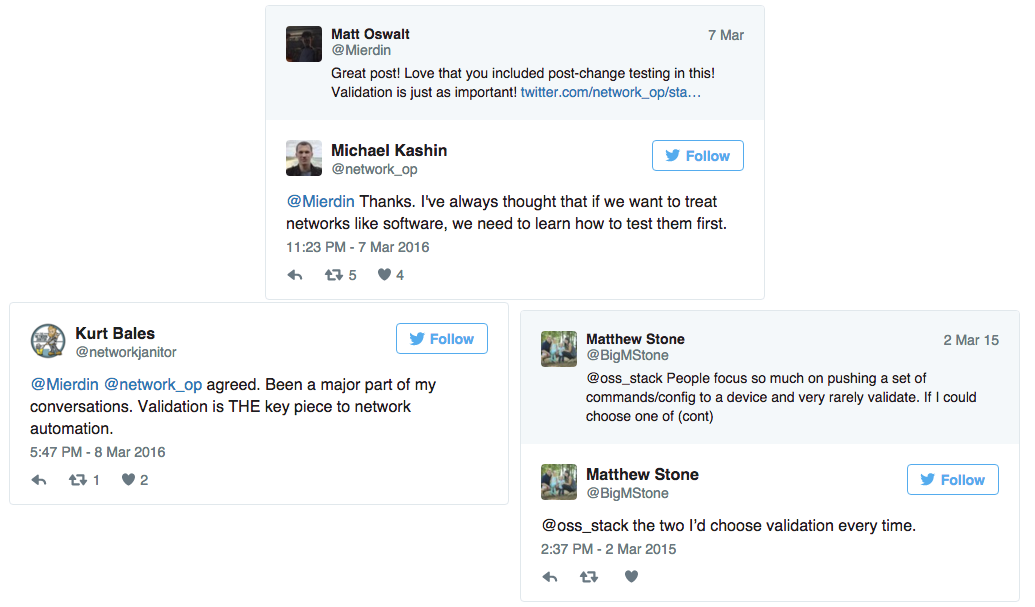
Over the past few years, I’ve seen (and contributed to) a rise of real network engineers taking on the new and sometimes challenging world of network automation. Every time I check in on Jason Edelman’s Network Automation Slack channel, I’m very happy to see the sheer number of folks asking questions, trying to get the the concepts and tools of network automation working in their own environment.
For many, this is all very new, and there’s a lot to soak up. Linux networking has broken onto the scene in a big way. We’ve started using text formats like YAML and Jinja2 to template out network configurations to make more consistent network changes. We’ve started using tools like Ansible to drive those changes in a meaningful way to our network infrastructure. It’s clear that these ideas are useful, and are taking hold in a big way.
At this point, I’d like to ask you this question; with all of this tooling, which admittedly helps us achieve consistency of change, does it really ensure the success of a change? How do we even define success? At what point can we sit back and be able to truly say, “that change did not negatively impact business services”? I would argue that the right answer is much more complicated than simply being content that config snippets have been pushed to a switch.
Over a year ago, I was fortunate to be a part of a conversation that touched on this exact topic at a Tech Field Day roundtable in Milan. In this discussion, it was mentioned that while easy enough to push changes in an automated fashion (i.e. “writing scripts”), there was still a requirement that a human being go back in and manually verify those changes, resulting in a more or less moot point.
As a result of this conversation, I was worried that others also believed that post-change validation still required a human being, and immediately began thinking of ways to change this.
In software development, there is a strong desire to be able to make changes to the source code of an application at any time of the day, but with the safety and predicability necessary to do this to production code. I wrote before about the idea of using these practices to produce some of the same benefits with network infrastructure, and I still believe in those concepts today.
To power a continuous integration pipeline, a developer will likely write a set of unit tests and integration tests for their software. If you really think about it, these tests do more than just execute code. They exist as reference implementations of that software. A properly written test is really a description of a particular avenue through which someone might run the software being developed.
The network automation story just doesn’t really have a proper analog of this concept today. Most network automation conversations talk at length about making changes to the network, but very rarely do I hear anyone talking about validating those changes in the same way a developer talks about validating changes to their source code with integration tests. Despite this, it’s clear to me that there’s a big interest in being able to do this kind of thing:
For now, let’s say the configuration problem has been solved. Again, how do we define success? We need a way to create a set of “tests” to run against our network infrastructure itself - not mere device configurations - that mimic our users’ and applications’ behavior. These tests could be run periodically, in order to get trending information about how well the network is performing, the status of connectivity between two points, etc. Or these tests could be run ad hoc to assist with troubleshooting.
Either way, the goal is to have a mechanism by which we can define success of change - and the only way to do that is to put your network through the same paces that the real-world does, and get detailed information back on how that test performed.
I am pleased to announce that today I am open sourcing one of my personal efforts in this space. I call it ToDD, which stands for “Testing on Demand: Distributed!”. I believe that ToDD offers a solution to just one piece of this problem, but a big one.
For those interested, ToDD is written in Go, and is being open-sourced today under an Apache v2 license.
Disclaimer: I currently work as a network software developer as part of my day job, but this effort is not affiliated with that in any way. I created this project on my personal time because I saw a need, and wanted to address that need while also learning a few new things myself.
Here are some high-level points about ToDD to consider before we dive in to the details:
There are also a few use cases where ToDD is especially useful:
The high-level design of ToDD is shown below:
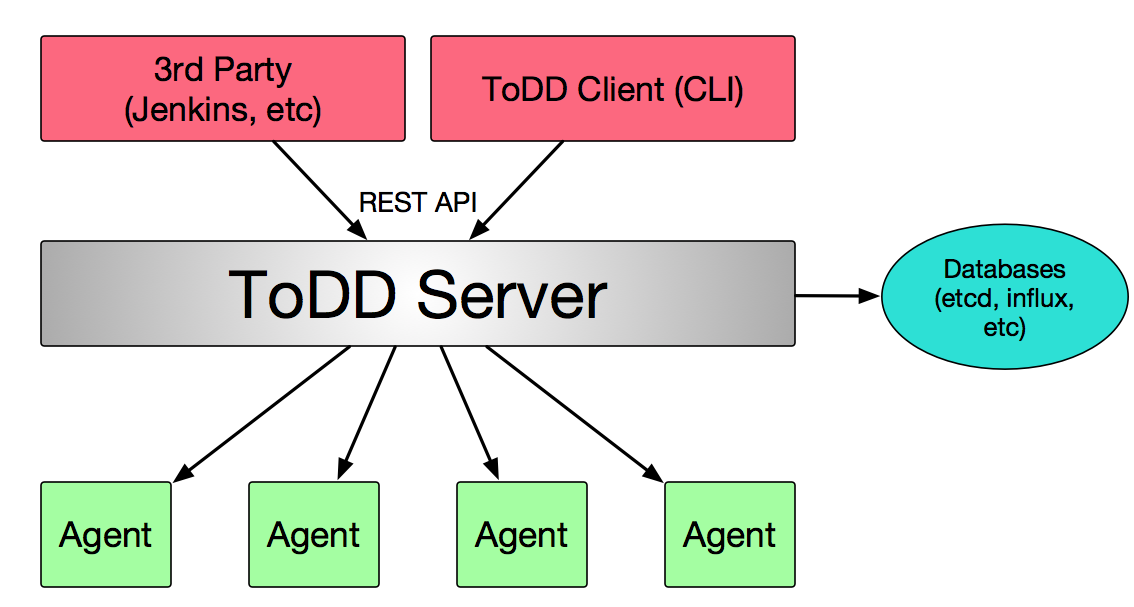
This is a fairly simple design. The server is responsible for orchestrating, but does not take part in tests amongst groups of agents. It also integrates with databases, manages agent registration activities, and provides API services northbound for the ToDD CLI client, or any other 3rd party services.
The agents communicate with the ToDD server, providing information about themselves and the environment they’re operating in. Things like the hostname of the system they’re running on, and properties of connected network interfaces. These “facts” are used by the ToDD server to place these agents into groups.
Since ToDD is written in Go, these agents could run just about anywhere you can compile the source for. Could be baremetal, VM, container, Raspberry Pi, or even a network switch!
For a complete high-level overview of ToDD, check out this video on these and other topics, complete with handy visuals:
Testlets are the mechanism by which ToDD standardizes testing, regardles of the underlying logic. Testlets standardize the input and output for running a test on an agent, so that ToDD can predictably pass data to a testing application, as well as predictably receive metrics from it once finished.

In this initial release of ToDD, I’ve written testlets for both “ping” and “iperf”, so in this sense, those testlets are just “wrapping” the underlying app, and parsing the output. However, this is absolutely not the limit of testlets. Any executable file is permitted here, so these could be written in bash, Python, or even compiled to a binary from languages like C or Go. Those testlets could wrap an existing, external application, or they could BE the testing application The possibilities are limitless - here are a few other ideas for testlets that I want to write:
Tests within ToDD are performed by one or more groups of agents. Testing is done by referencing group names, so ultimately, we need to get these agents into groups. Before we get to that point, let’s jump in to some CLI examples, using the ToDD client to query what agents are currently registered to the ToDD server:
mierdin@todd-1:~$ todd agents
UUID        EXPIRES ADDR        FACT SUMMARY        COLLECTOR SUMMARY
902a5fca2f41    30s 172.17.0.8  Addresses, Hostname get_addresses, get_hostname
014028d91741    24s 10.128.0.3  Addresses, Hostname get_addresses, get_hostname
e793653ada53    26s 10.128.0.4  Addresses, Hostname get_addresses, get_hostname
d1267fed5c58    27s 10.128.0.5  Addresses, Hostname get_addresses, get_hostname
332d8a47d348    29s 172.17.0.6  Addresses, Hostname get_addresses, get_hostname
cda3e68485bd    30s 172.17.0.7  Addresses, Hostname get_addresses, get_hostname
Looks like we have 6 agents, and 3 of them are in our “datacenter” subnet 172.17.0.0/16, and the remaining 3 are in our “headquarters” subnet 10.128.0.0/16. Though it may be tempting to rely on the “ADDR” column for this info, it’s actually the fact “Addresses” under the “FACT SUMMARY” column that the grouping mechanism will look at, so let’s confirm that by looking at a specific agent for a more detailed view of these facts:
mierdin@todd-1:~$ todd agents 902a5fca2f41
Agent UUID:  902a5fca2f41647f75122b8039fdb93067d6614b47d57070a0c6cf7e3ec25f23
Expires:  19s
Collector Summary: get_addresses, get_hostname
Facts:
{
    "Addresses": [
        "127.0.0.1",
        "::1",
        "172.17.0.8",
        "fe80::42:acff:fe11:8"
    ],
    "Hostname": [
        "ea31aac10afd"
    ]
}
Group definitions for ToDD are written in YAML. Here’s an example group definition we’d write for our “datacenter” agents to ensure they are placed into a group called “datacenter”:
---
type: group
label: datacenter
spec:
    group: datacenter
    matches:
    - within_subnet: "172.17.0.0/16"
Once we’ve written this, we can use “todd create” to upload this definition to the ToDD server:
mierdin@todd-1:~$ todd create group-datacenter.yml
[OK]
After we write another group definition for our “headquarters” subnet, we can validate these objects are present within ToDD by using the “todd objects < object type >” command:
mierdin@todd-1:~$ todd objects group
LABEL           TYPE    SPEC
datacenter      group   {datacenter [map[within_subnet:172.17.0.0/16]]}
headquarters    group   {headquarters [map[within_subnet:10.128.0.0/16]]}
Periodically, the ToDD server will evaluate the currently registered agents against these group definitions, and place each agent in a group. This group mapping is available via the simple “todd groups” command:
mierdin@todd-1:~$ todd groups
UUID            GROUP NAME
cda3e68485bd    datacenter
d1267fed5c58    headquarters
e793653ada53    headquarters
014028d91741    headquarters
332d8a47d348    datacenter
902a5fca2f41    datacenter
Now that we have registered and grouped agents, we are ready to move on to testing!
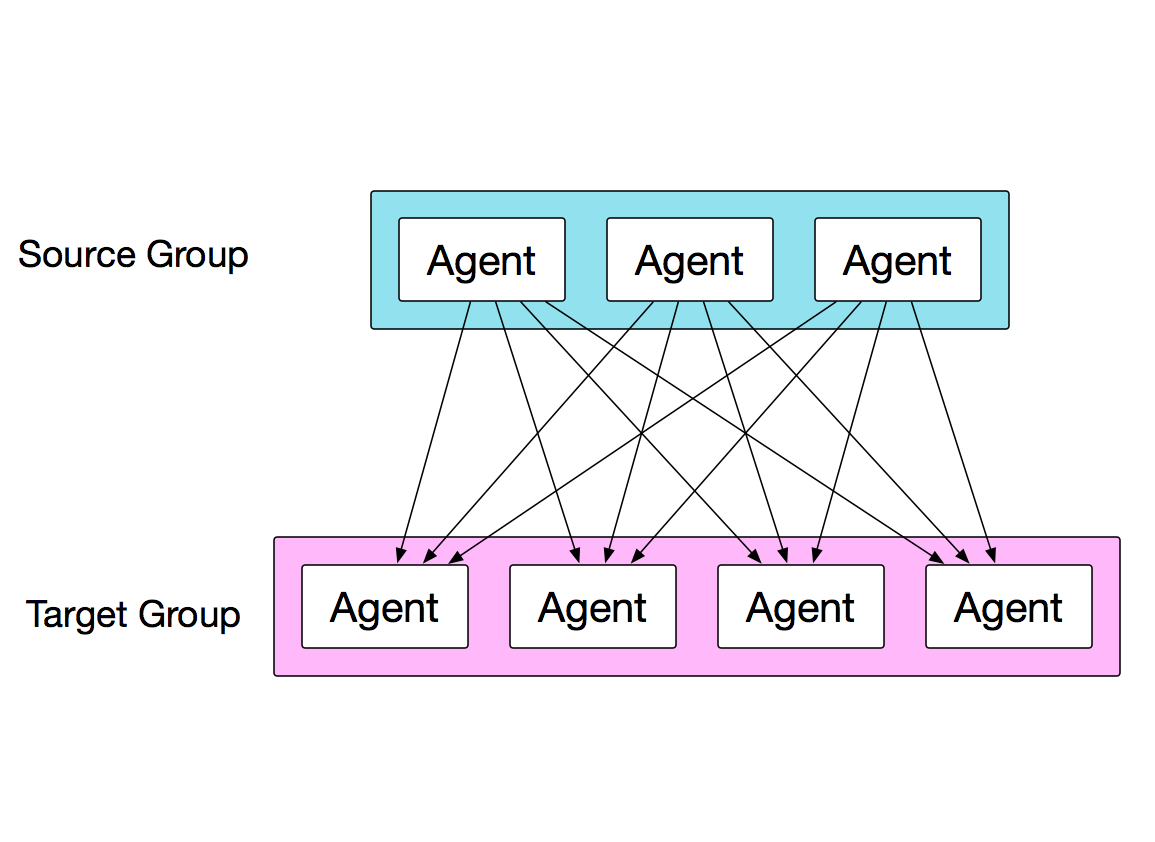
A typical test-run example in ToDD is from a group of agents to a list of targets, such as IP addresses or FQDNs:
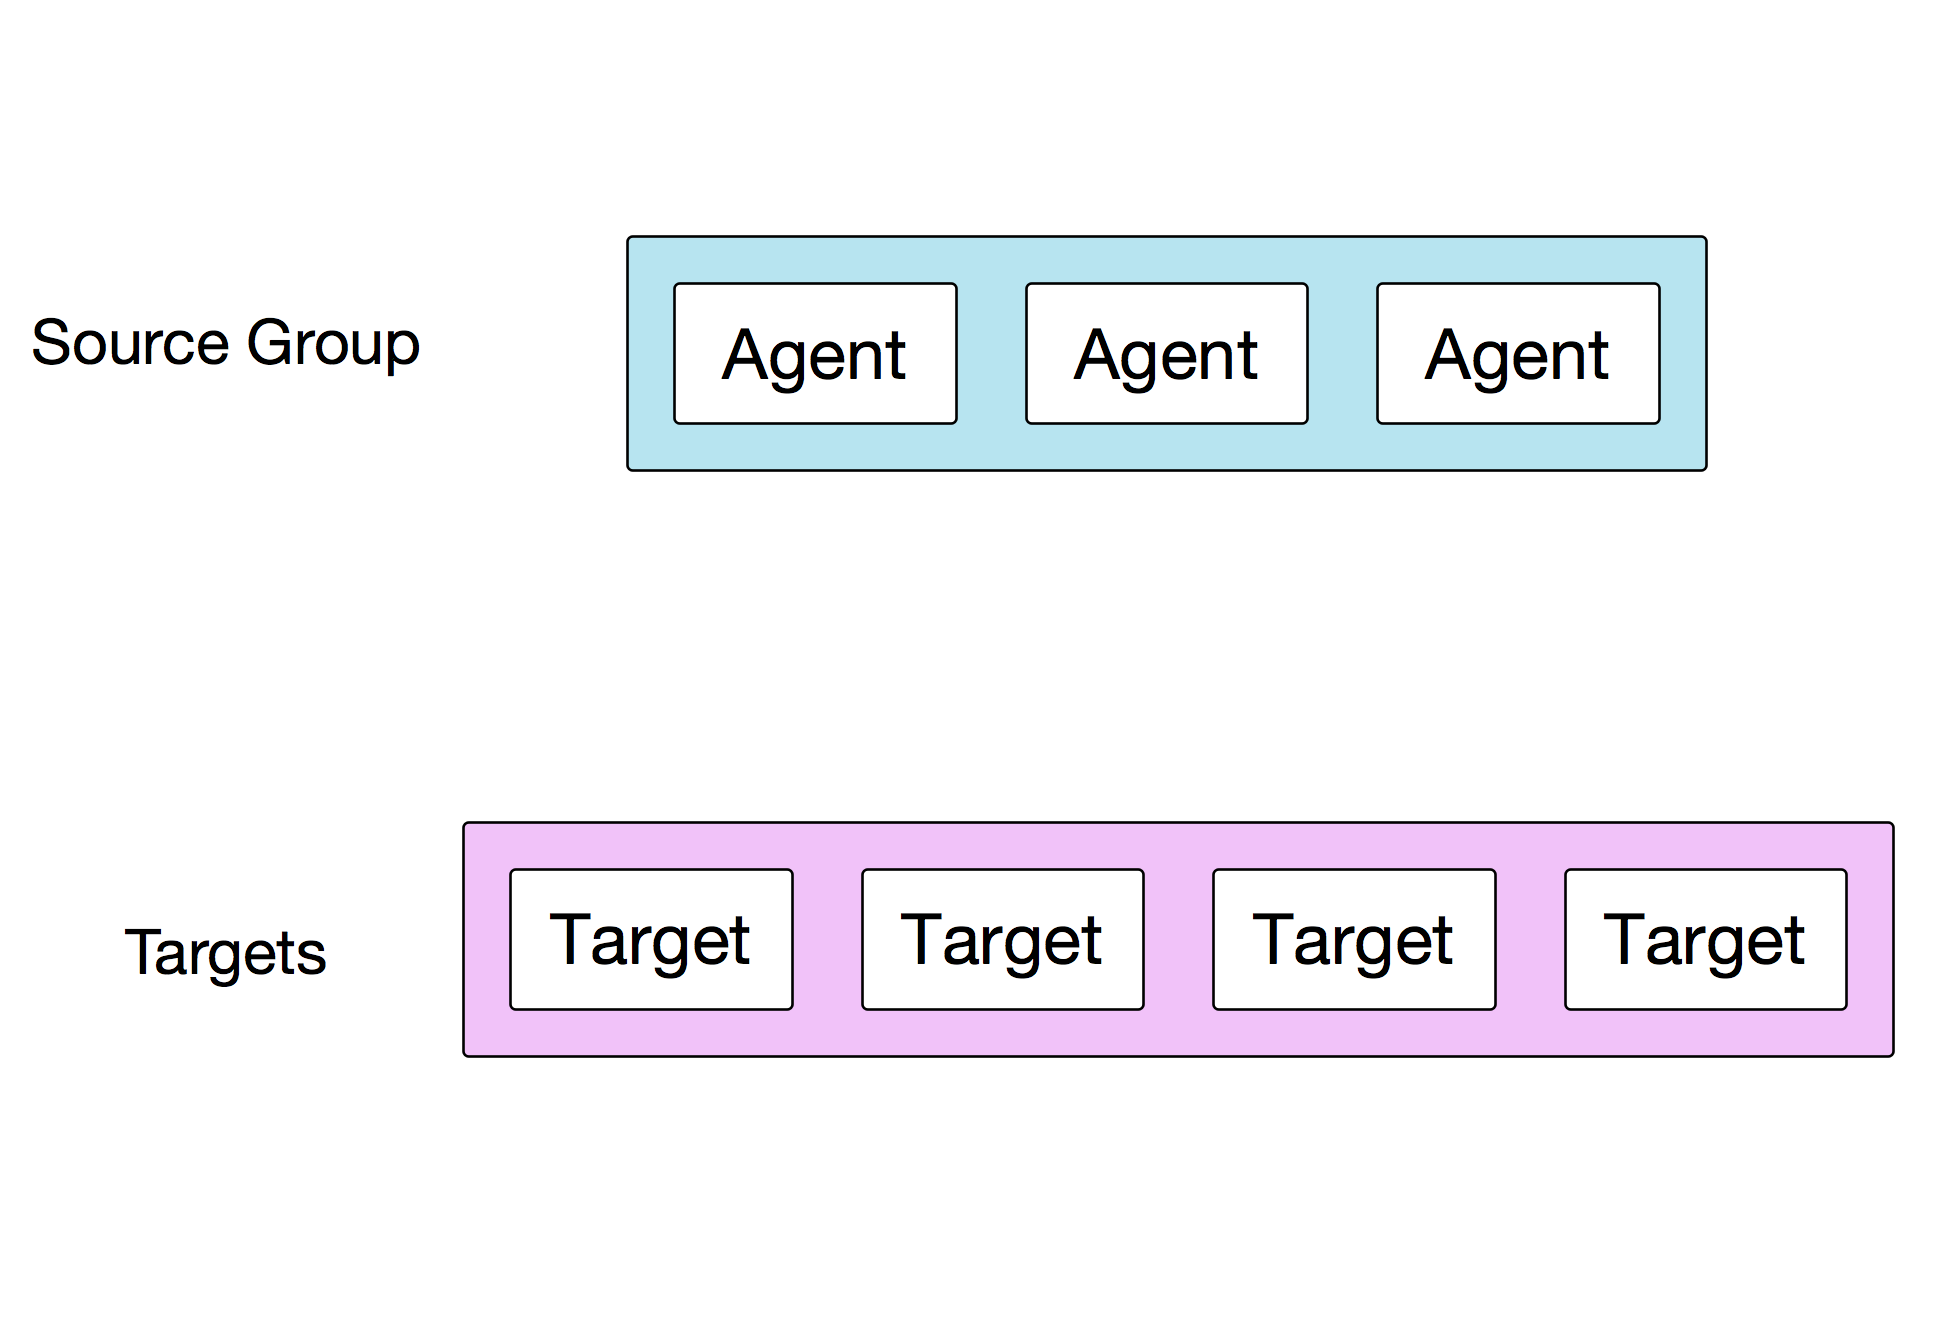
To keep the value of the test as high as possible, each agent will spawn one thread per target, and run tests against each of them simultaneously.

However, each agent in the source group will also be doing the same thing, at the same time:
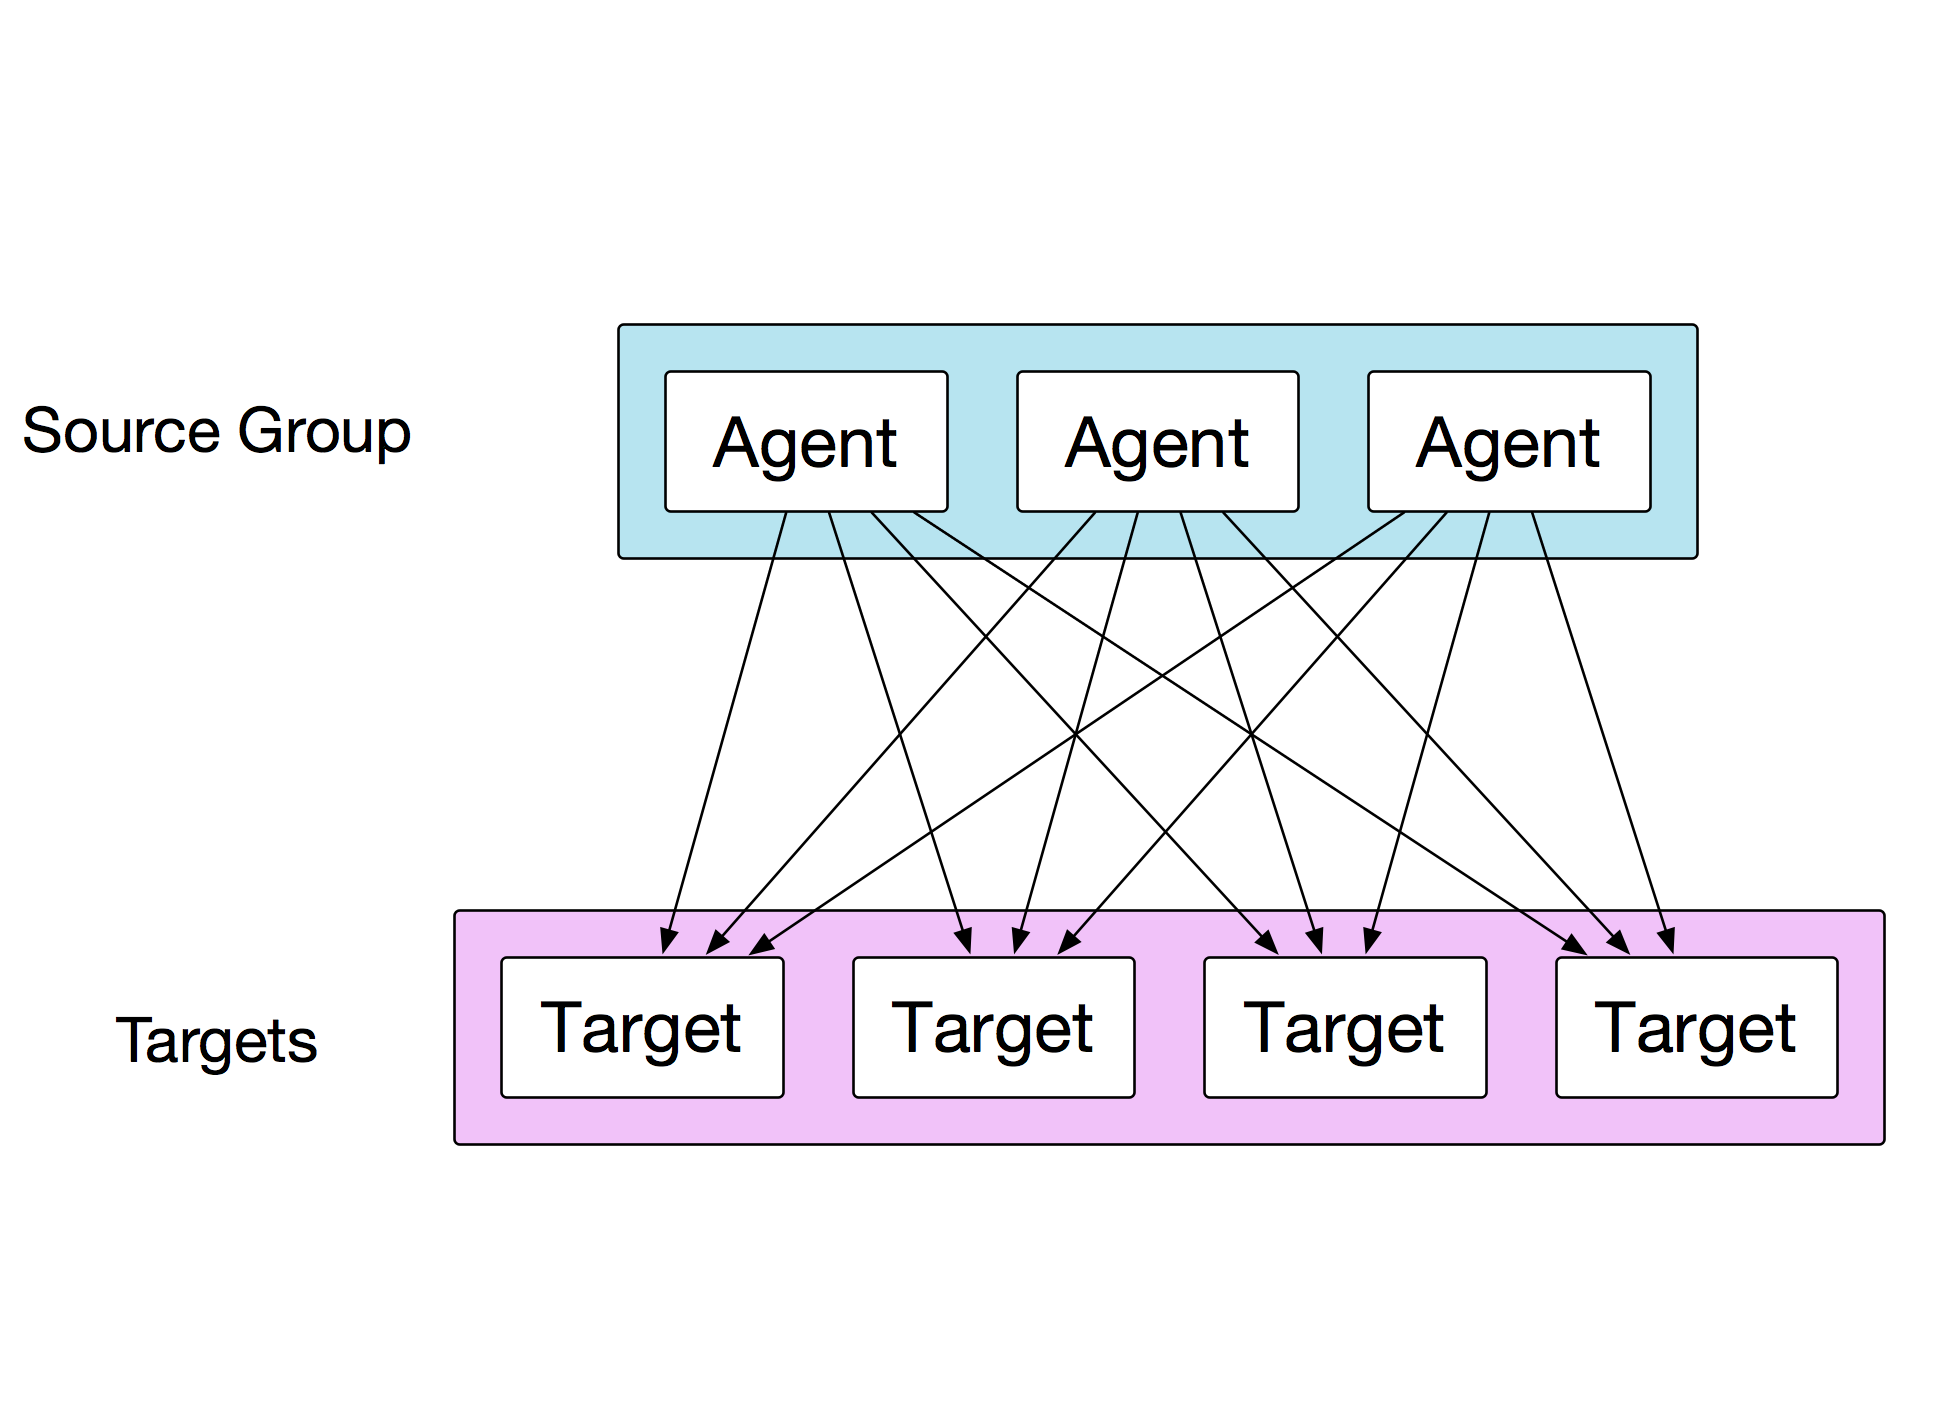
This means effectively that all targets are being tested by all source agents at the same time. This makes the test much more powerful. Each agent will report aggregated metrics about each test/target back to the server, and the server will aggregate all of these reports into one big blob of metric data and write it to the database.
This is all great, and there are plenty of useful applications that can be run aginst a set of uncontrolled IP addresses as shown in the purple box below. What if we could control those nodes too, by deploying ToDD agents to them?
In this diagram, we are actually targeting another group of ToDD agents. In this case, the ToDD server will spin up some kind of process on the targets first, and then once those are all running, the sources can run their test.
Think about an example like iperf, where a client and a server must be provisioned in order to run a test. Combine that with the full-mesh testing capabilities shown here, and you have a very powerful way to produce a lot of network load from a bunch of points on your network. We could easily do this with the group mapping that we currently have - we could actually run iperf tests between ALL nodes of our datacenter, and ALL nodes in our headquarters. Talk about throughput!!
Another great example is HTTP testing with a client tool like curl. You may not have a proper webserver you’re willing to test against, so you could use this model to also spin up a bunch of webservers to connect to.
Finally, one of the best features of ToDD is that you can increase the power of a test by increasing the number of agents. Since we’ve already added our group definitions, we need only spin up additional agents that would have similar properties:

Since we are grouping according to our datacenter subnet, any new nodes should get an IP address in this subnet, and will automatically be grouped accordingly by ToDD.
Test runs in ToDD are defined similarly to how we defined groups in a previous section. They’re just another object type, defined in YAML. Testrun objects describe the parameters of a given test.
I like to think of testrun objects within ToDD as integration tests for your network. As of this version of the software, you as the operator will have to make your own assertions on the data that ToDD provides, but in the future ToDD may simplify even this.
Let’s jump in to actually running a test. Tests are executed using “testrun” objects, which are very similar to grouping objects. You define them in YAML, and you upload them to the ToDD server using “todd create” Here’s an example where we use our “datacenter” group to execute the “ping” test against two uncontrolled IP addresses:
---
# Example test file
type: testrun
label: test-ping-dns-dc
spec:
    targettype: uncontrolled
    source:
        name: datacenter
        app: ping
        args: "-c 10"
    target:
    - 4.2.2.2
    - 8.8.8.8
As with group objects, we can upload this file to the server using “todd create”, and once there, we execute it with “todd run”:
mierdin@todd-1:~$ todd create todd/docs/dsl/test-ping-dns-from-datacenter.yml
mierdin@todd-1:~$ todd run test-ping-dns-dc -j -y
The “-j” flag instructs the ToDD client to output the resulting test metrics to our terminal as a JSON document. The “-y” flag skips the testrun confirmation message, so we can just execute the test right away.
The ToDD client will actually subscribe to a stream of JSON data provided by the server so you can get a real-time status of how the test is proceeding. The resulting output shows this as well as the JSON we requested:
mierdin@todd-1:~$ todd run test-ping-dns-dc -j -y

RUNNING TEST: fc7533208c1966a1ca77f645f8897f03c840e8257e4833fab6b5a3d375802991

(Please be patient while the test finishes...)

 2016-03-10 02:11:16.395158605 +0000 UTC INIT: (0/3)  READY: (0/3)  TESTING: (0/3)  FINISHED: (3/3)

Done.

{
  "26ac20f91e5f9389ee9a9f4df9622501e3e2470e51525ba43487c58c77d27e61": {
    "4.2.2.2": {
      "avg_latency_ms": "10.834",
      "packet_loss_percentage": "0"
    },
    "8.8.8.8": {
      "avg_latency_ms": "0.798",
      "packet_loss_percentage": "0"
    }
  },
  "727c8ac4c8be25ef03da897586b98ed9c4dfc05d0c93c363498d2aafd8f99ed1": {
    "4.2.2.2": {
      "avg_latency_ms": "10.773",
      "packet_loss_percentage": "0"
    },
    "8.8.8.8": {
      "avg_latency_ms": "0.925",
      "packet_loss_percentage": "0"
    }
  },
  "f37c3155dd8ae7b87d2a4a0ddc27ed17d8130ae221f82cfe9c726a20bad8f1a1": {
    "4.2.2.2": {
      "avg_latency_ms": "10.751",
      "packet_loss_percentage": "0"
    },
    "8.8.8.8": {
      "avg_latency_ms": "0.813",
      "packet_loss_percentage": "0"
    }
  }
}
This output is fairly simple to read, and consistent across test runs, and types. The outer JSON key is the UUID of the ToDD agent, and inside each one, there is a key representing the IP address of the target in question. Each target has it’s own test metrics within that, which are totally provided by the testlet. The ToDD agent will parse whatever the testlet provides to stdout.
Note also that we can override some of the parameters of the testrun object by the optional arguments shown in the help output for “todd run”:
mierdin@todd-1:~$ todd run --help
NAME:
   todd run - Execute an already uploaded testrun object

USAGE:
   todd run [command options] [arguments...]

OPTIONS:
   -j           Output test data for this testrun when finished
   -y           Skip confirmation and run referenced testrun immediately
   --source-group   The name of the source group
   --source-app     The app to run for this test
   --source-args    Arguments to pass to the testlet
This is very useful for one-off testing, like troubleshooting a network issue.
Now - as mentioned before, we can actually use another group of ToDD agents as a target for our tests. Obviously this depends on the application being used. In our case, we’ll use “iperf”, which has both a client and server component - so it’s a perfect example for this feature. The testrun object is below:
---
# Example test file
type: testrun
label: test-dc-hq-bandwidth
spec:
    targettype: group
    source:
        name: datacenter
        app: iperf
        args: "-c {{ target }}"
    target:
        name: headquarters
        app: iperf
        args: "-s"
Note that we have to also provide group, testlet, and args for our target agents now as well. Also note that the “{{ target }}” notation in the args for the source agents. This is a keyword that the ToDD agent will recognize if present in the args, and will replace with a target IP address at runtime. This is useful for apps like iperf that actually require the target IP address in the arguments, instead of how it’s normally provided to the testlet.
This may be a different type of test, but it runs the same way:
mierdin@todd-1:~$ todd run test-dc-hq-bandwidth -j -y

RUNNING TEST: 2ca3f586433e72ba64a9f77ffda69f4f633f9c665aa29e9bdc1a92f66d0e3e1c

(Please be patient while the test finishes...)

 2016-03-10 02:19:08.99999879 +0000 UTC INIT: (0/6)  READY: (0/6)  TESTING: (0/6)  FINISHED: (6/6))

Done.

{
  "26ac20f91e5f9389ee9a9f4df9622501e3e2470e51525ba43487c58c77d27e61": {
    "10.128.0.3": {
      "bandwidth_mbits_sec": "178",
      "tcp_window_size_mbyte": "0.04",
      "transfer_mbytes": "213"
    },
    "10.128.0.4": {
      "bandwidth_mbits_sec": "632",
      "tcp_window_size_mbyte": "0.04",
      "transfer_mbytes": "753"
    },
    "10.128.0.5": {
      "bandwidth_mbits_sec": "216",
      "tcp_window_size_mbyte": "0.04",
      "transfer_mbytes": "259"
    }
  },
  "727c8ac4c8be25ef03da897586b98ed9c4dfc05d0c93c363498d2aafd8f99ed1": {
    "10.128.0.3": {
      "bandwidth_mbits_sec": "263",
      "tcp_window_size_mbyte": "0.04",
      "transfer_mbytes": "313"
    },
    "10.128.0.4": {
      "bandwidth_mbits_sec": "248",
      "tcp_window_size_mbyte": "0.04",
      "transfer_mbytes": "297"
    },
    "10.128.0.5": {
      "bandwidth_mbits_sec": "592",
      "tcp_window_size_mbyte": "0.04",
      "transfer_mbytes": "706"
    }
  },
  "f37c3155dd8ae7b87d2a4a0ddc27ed17d8130ae221f82cfe9c726a20bad8f1a1": {
    "10.128.0.3": {
      "bandwidth_mbits_sec": "310",
      "tcp_window_size_mbyte": "0.10",
      "transfer_mbytes": "370"
    },
    "10.128.0.4": {
      "bandwidth_mbits_sec": "652",
      "tcp_window_size_mbyte": "0.04",
      "transfer_mbytes": "778"
    },
    "10.128.0.5": {
      "bandwidth_mbits_sec": "672",
      "tcp_window_size_mbyte": "0.04",
      "transfer_mbytes": "802"
    }
  }
}
That went by quickly, and for brevity, I left out a few steps. If you want to see the full demonstration, please review this video I made of the process end-to-end:
All of this data is great, but it’s a little boring to just stare at JSON all day. So, the initial release of ToDD also integrates with InfluxDB, which is a time-series database well-suited to this kind of data. ToDD will output all of the metrics data you saw in the previous example, as well as all useful metadata, like the agents and groups participating in the test, and provide all of it to InfluxDB.
ToDD will not upload test metrics for tests if you override any of the testrun object parameters using the optional “todd run” arguments. This is because time-series data needs to come from the same source, otherwise it’s not a valid comparison. So if you are intending to run todd on a schedule to get trending data, be sure to not use these options.
Once that’s done, we can use a visualization tool like Grafana to really make this data work for us:

ToDD is hardly a finished product. There are many things that I want to go work on once this initial release has been offered. Here is a brief list of things that are top-of-mind for me:
Please check out the ToDD repository, and in particular, CONTRIBUTING.md for guidelines on contributing, if you are inclined to do so.
I will be working in the next few weeks to transfer all of my informal documentation to a more readable, consumable format at the ToDD ReadTheDocs site. It’s a bit empty right now, but check back frequently, as I’ll be updating it very soon. If you feel something is missing, or wish to contribute, open a Github issue on the ToDD repo and we’ll have a discussion about it.
If you have any immediate feedback, the best way to reach me is Twitter.
I hope this software is useful, and becomes a powerful tool in the arsenal of network automators everywhere. Let’s move forward with Test-Driven Network Automation and Continuous Integration!