Title here
Summary here
January 22, 2014 in Systems7 minutes
This will be a short follow-up to my last post about the idea of Flow Control in storage protocols. As a review, the three main options in common use today are:
The last item is really the only one that warrants any kind of configuration, as the first two are more or less baked into the protocol stacks. So I will be outlining an example implementation of FCoE using Priority Flow Control here, using a pair of Nexus 5000 switches connected to a Cisco UCS Fabric Interconnect pair in a multi-hop FCoE configuration.
A simple policy map can be used to identify a class of traffic that you want to run PFC on. I’m doing this for the purposes of running FCoE
policy-map type network-qos system-level-net-qos
  class type network-qos class-fcoe
    pause no-drop
    mtu 2158
NX-OS also has a built-in policy for FCoE specifically, but by defining my own policy map I can make changes to other traffic types at the same time.
The “pause no-drop” command is how we apply Priority Flow Control. With this command, the switch knows to use this class to send pause frames to upstream (or downstream) devices to manage congestion when it happens. It also means that traffic in this class will not be dropped as an additional congestion management technique - essentially providing us with the revered “lossless” Ethernet.
In UCS, we have a GUI representation of the exact same Modular QoS CLI (MQC) structure (no surprise considering the Fabric Interconnects run NXOS under the covers). SSH into a fabric interconnect, and run “connect nxos” then “show run” and you’ll see that all of these values have been reproduced in that format.
Here, the work for FCoE is mostly already done for us:
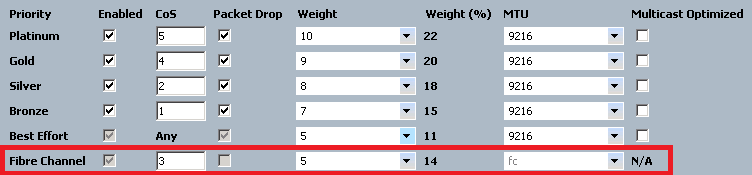
As you can see, our options for FCoE are somewhat limited, and for good reason. The “enabled” checkbox is checked permanently. If you’re using UCS virtual HBAs, then you’re using FCoE whether you like it or not, regardless of what’s sitting above your fabric interconnects - so this isn’t optional. Neither is the MTU setting, showing “fc” here but is actually 2158 bytes.
What we can customize is the CoS value used for FCoE (though I would caution against changing this, as it is generally accepted that this is used for FCoE) as well as the “weight” field - which in my opinion is a rather clunky way of configuring bandwidth reservations. These bandwidth reservations operate on a “minimum” basis rather than “maximum” (cough HP Flex-10). So, these percentages only take effect when there is some kind of congestion. In the absence of congestion, individual traffic classes are permitted to exceed these values.
Okay, that’s all well and good but what happens when things don’t work? What options do we have for troubleshooting?
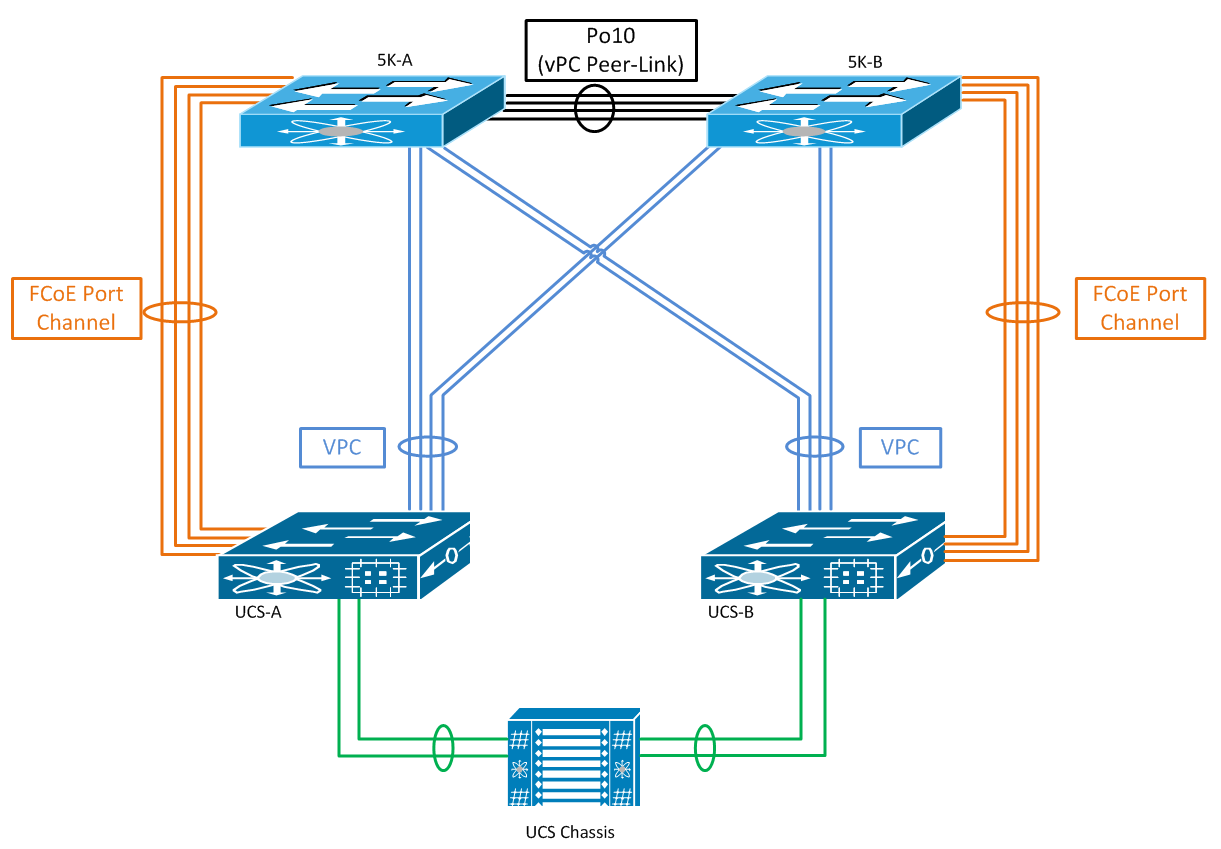
Relevant anecdote: I was recently installing exactly this setup - a pair of Nexus 5Ks with a pair of UCS fabric interconnects. In a multi-hop FCoE design, you generally create an FCoE uplink port channel from UCS to it’s own 5K (no vPC, just a port channel to a single switch). Something like this:
The customer I was working with was complaining that they were experiencing I/O errors for virtual machines stored on FCoE LUNs. I didn’t see any issue with WWPN FLOGIs - everything was connected as expected and wasn’t flapping. All paths were showing as up and operational within vSphere. So it was difficult for me to do anything but assume the storage array was having issues.
The first thing you can do in any networking scenario when you experience some kind of traffic loss is viewing interface statistics - this one’s a no-brainer:
N5K-A# show int e1/47 | b RX
  RX
    1080175173 unicast packets  267274 multicast packets  0 broadcast packets
    1080442447 input packets  940011527851 bytes
    408085654 jumbo packets  0 storm suppression bytes
    0 runts  0 giants  0 CRC  0 no buffer
    0 input error  0 short frame  0 overrun   0 underrun  0 ignored
    0 watchdog  0 bad etype drop  0 bad proto drop  0 if down drop
    0 input with dribble  0 input discard
    0 Rx pause
  TX
    1762673041 unicast packets  892556 multicast packets  0 broadcast packets
    1763565597 output packets  1186046939577 bytes
    366870638 jumbo packets
    0 output error  0 collision  0 deferred  0 late collision
    0 lost carrier  0 no carrier  0 babble 0 output discard
    0 Tx pause
Always a good idea to check interface-level statistics. After all, if Layer 1’s not working, nothing else will (until we get software-defined cables).
The next step is to use a command that’s incredibly useful for a few reasons. First, every interface adheres to some kind of QoS policy, whether globally defined in the switch (under “system qos” in NXOS) or attached to the interface itself. Either way, you can view the properties for each queue present on an interface by using the keyword “queuing” as shown below:
Ethernet1/47 queuing information:
(some output omitted for brevity)
  RX Queuing
    qos-group 1
    q-size: 79360, HW MTU: 2158 (2158 configured)
    drop-type: no-drop, xon: 20480, xoff: 40320
    Statistics:
        Pkts received over the port             : 435463231
        Ucast pkts sent to the cross-bar        : 435303127
        Mcast pkts sent to the cross-bar        : 0
        Ucast pkts received from the cross-bar  : 3774439486
        Pkts sent to the port                   : 3774439486
        Pkts discarded on ingress               : 160104
        Per-priority-pause status               : Rx (Inactive), Tx (Active)
Through this we can see that we have no-drop configured on this qos-group, in addition to an MTU of 2158. The QOS group with an ID of 1 is reserved for FCoE traffic in NXOS. Below is a few QoS-specific interface statistics. Note that these stats are all part of QoS group 1, which means that other groups configured on this interface have their own statistics. Hugely useful in determining which type of traffic is having the problem. The “Pkts discarded on ingress” field is what drew my attention.
Naturally these shouldn’t show up in interface statistics, since they were dropped by the queuing mechanisms on the switch, and not strictly the interface itself. But why was it being dropped in the first place?
A useful command to know when implementing Priority Flow Control is (shocker) “show interface priority-flow-control”. In troubleshooting, this command showed that PFC was operationally disabled for my FCoE connections to the downstream UCS Fabric Interconnects:
5K-A# show interface priority-flow-control
============================================================
Port               Mode Oper(VL bmap)  RxPPP      TxPPP
============================================================

Ethernet1/47       Auto Off           7316       762946
Ethernet1/48       Auto Off           7428       761362
Ethernet4/15       Auto Off           0          0
Ethernet4/16       Auto Off           0          0
You can always statically enable PFC on an interface:
5K-A(config)# int e1/47
5K-A(config-if)# priority-flow-control mode on
However, in normal circumstances it’s best to allow automatic negotiation to take place. This is made possible by a protocol called Data Center Bridging Exchange (DCBX) and is the subject of a future blog post (whole other can of worms). For now, suffice it to say that the configuration in UCS didn’t match the configuration in my upstream Nexus 5Ks.
The reason for this was that I had unchecked the “drop” checkbox in my Platinum class - this is the default in UCS, so if you don’t disable the class or enable drops, then there will be two queues with no-drop enabled.
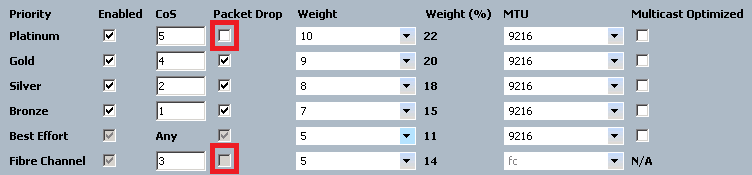
Now - UCS supports up to two classes with no-drop treatment, so this is totally a valid configuration, but ONLY if the upstream switch (5K) configuration matches. Mine didn’t - I was not intending to use the platinum class for no-drop treatment, and the Nexus configuration reflects that:
policy-map type network-qos system-level-net-qos
  class type network-qos class-platinum
    set cos 5
    mtu 9216
  class type network-qos class-fcoe
    pause no-drop
    mtu 2158
DCBX exchanged these two policies on the links used for FCoE, and since this property did not match on this class, PFC was disabled. This is normal behavior, according to Cisco’s FCoE Operations Guide:
If the DCBX negotiation fails between a host and switch or between a switch and switch, the PFC setting will not be set on the Nexus 5000 Series switch and the vFC interfaces will remain down until the DCB configuration matches.
The proper way to fix this is to ensure your configuration matches end-to-end. This is very important in really any multi-hop FCoE configuration.
Stay tuned for a future post regarding the ins and outs of the Datacenter Bridging (DCB) suite of protocols, of which DCBX is a member. In the meantime, here is a nice collection of resources when considering working with these technologies on Cisco Nexus and UCS: